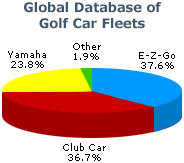
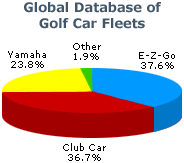
We maintain a database of every golf car fleet in the world with number of cars, make of cars including mixed fleets, age of fleet, owned or leased, gas or electric. The survey is repeated every year to give up to the minute information and trend data. This report summarises the data for the continent.
The Canadian Golf Car Report
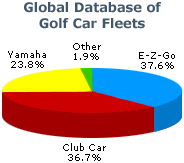
We maintain a database of every golf car fleet in the world with number of cars, make of cars including mixed fleets, age of fleet, owned or leased, gas or electric. The survey is repeated every year to give up to the minute information and trend data. This report summarises the data for the continent.
The Japanese Golf Car Report
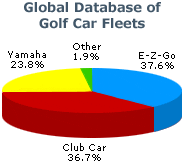
We maintain a database of every golf car fleet in the world with number of cars, make of cars including mixed fleets, age of fleet, owned or leased, gas or electric. The survey is repeated every year to give up to the minute information and trend data. This report summarises the data for the continent.
The US Golf Car Report
We maintain a database of every golf car fleet in the world with number of cars, make of cars including mixed fleets, age of fleet, owned or leased, gas or electric. The survey is repeated every year to give up to the minute information and trend data. This report summarises the data for the continent.
The map on the following page shows the variation in green fee prices over Europe. The most expensive areas appear to be Austria, Switzerland, northern Italy and the coasts of France, Spain and Portugal, Cheaper golf can be found all over Scandinavia, the Netherlands and Eire.